
dsh-web
zhu1090093659/dsh-webDeepSeek Harness(DSH)Web 插件聚合生态包 · 一切皆插件,创意工坊分发(dsh-market.com)

Plugin dependency graph for DeepSeek Harness: which plugin provides the services every other plugin injects, read from the live Cordis runtime.
English | 中文
Which plugin provides the services every other plugin injects — read from the live Cordis runtime, not from a manifest.
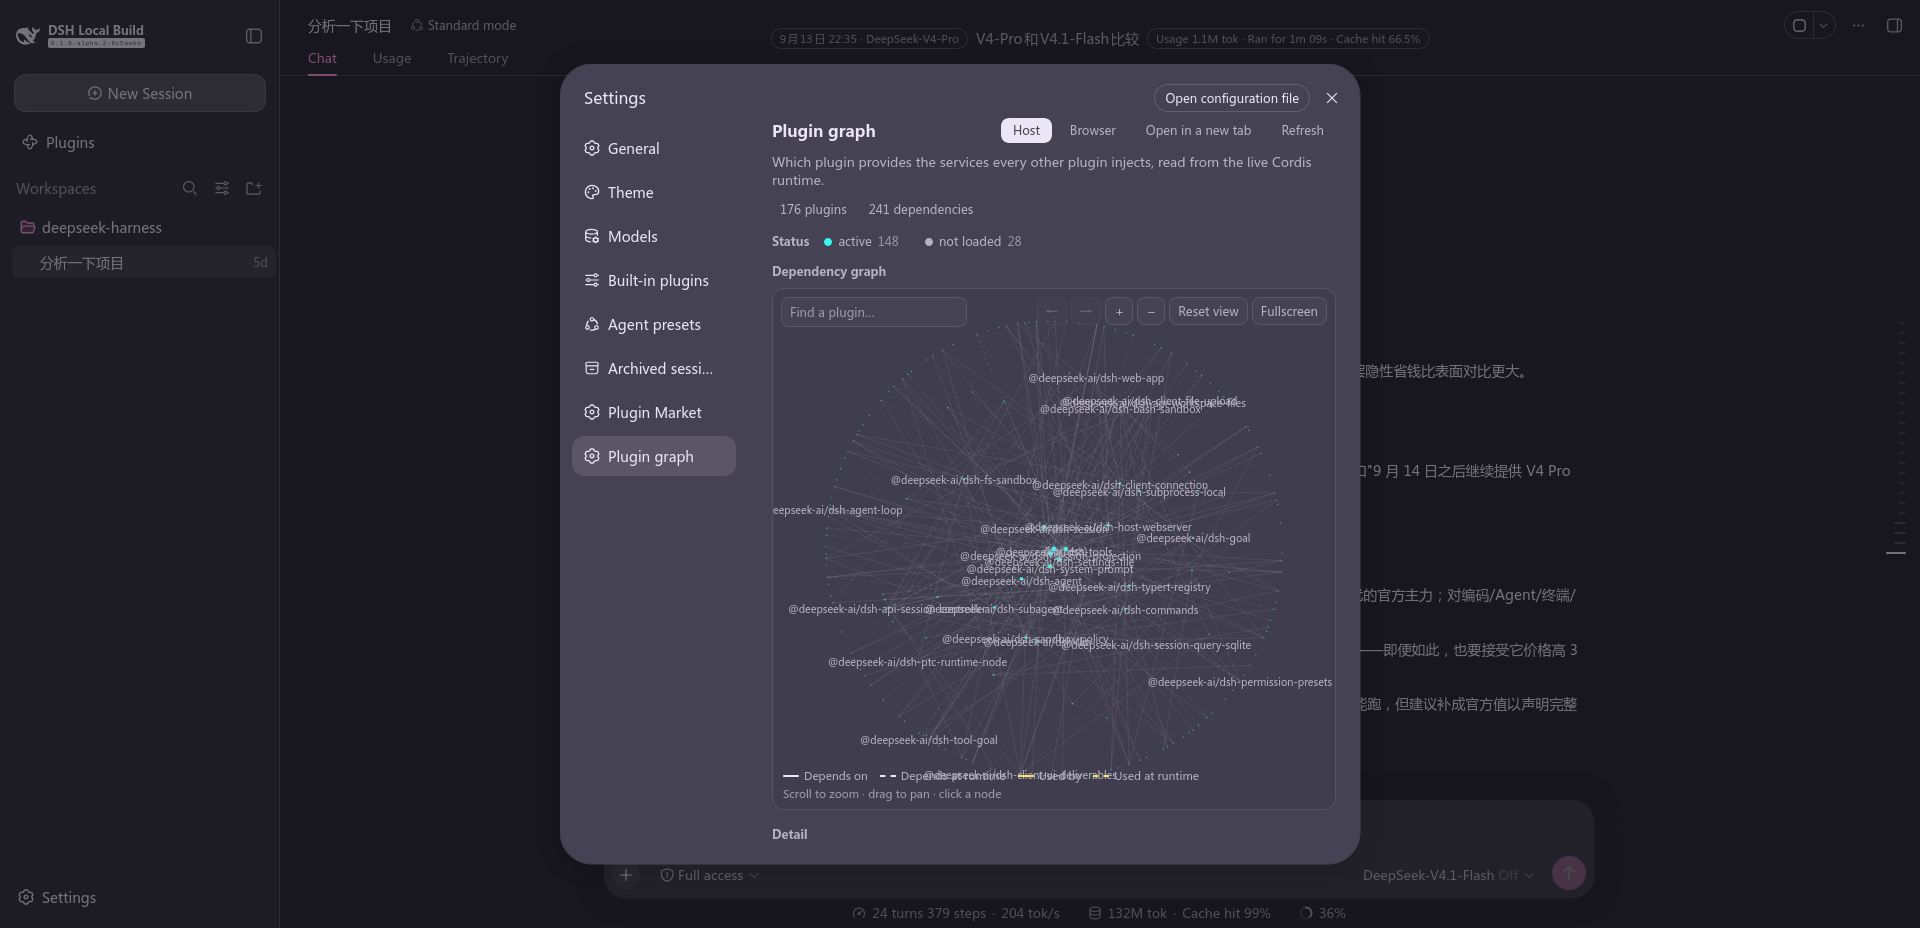
A settings section draws the graph, and a standalone page shows the same graph at full width. Both render the same panel: the two hosts differ only in what they can supply (a locale service, a theme, a window instead of a settings column).
The section, as it opens: the counts, the status row (a dot per state the graph has, its
count, and a click that filters to it), the drawing, and the four-line key in the corner.
The controls above the drawing are ← → (selection history), zoom, reset and fullscreen.
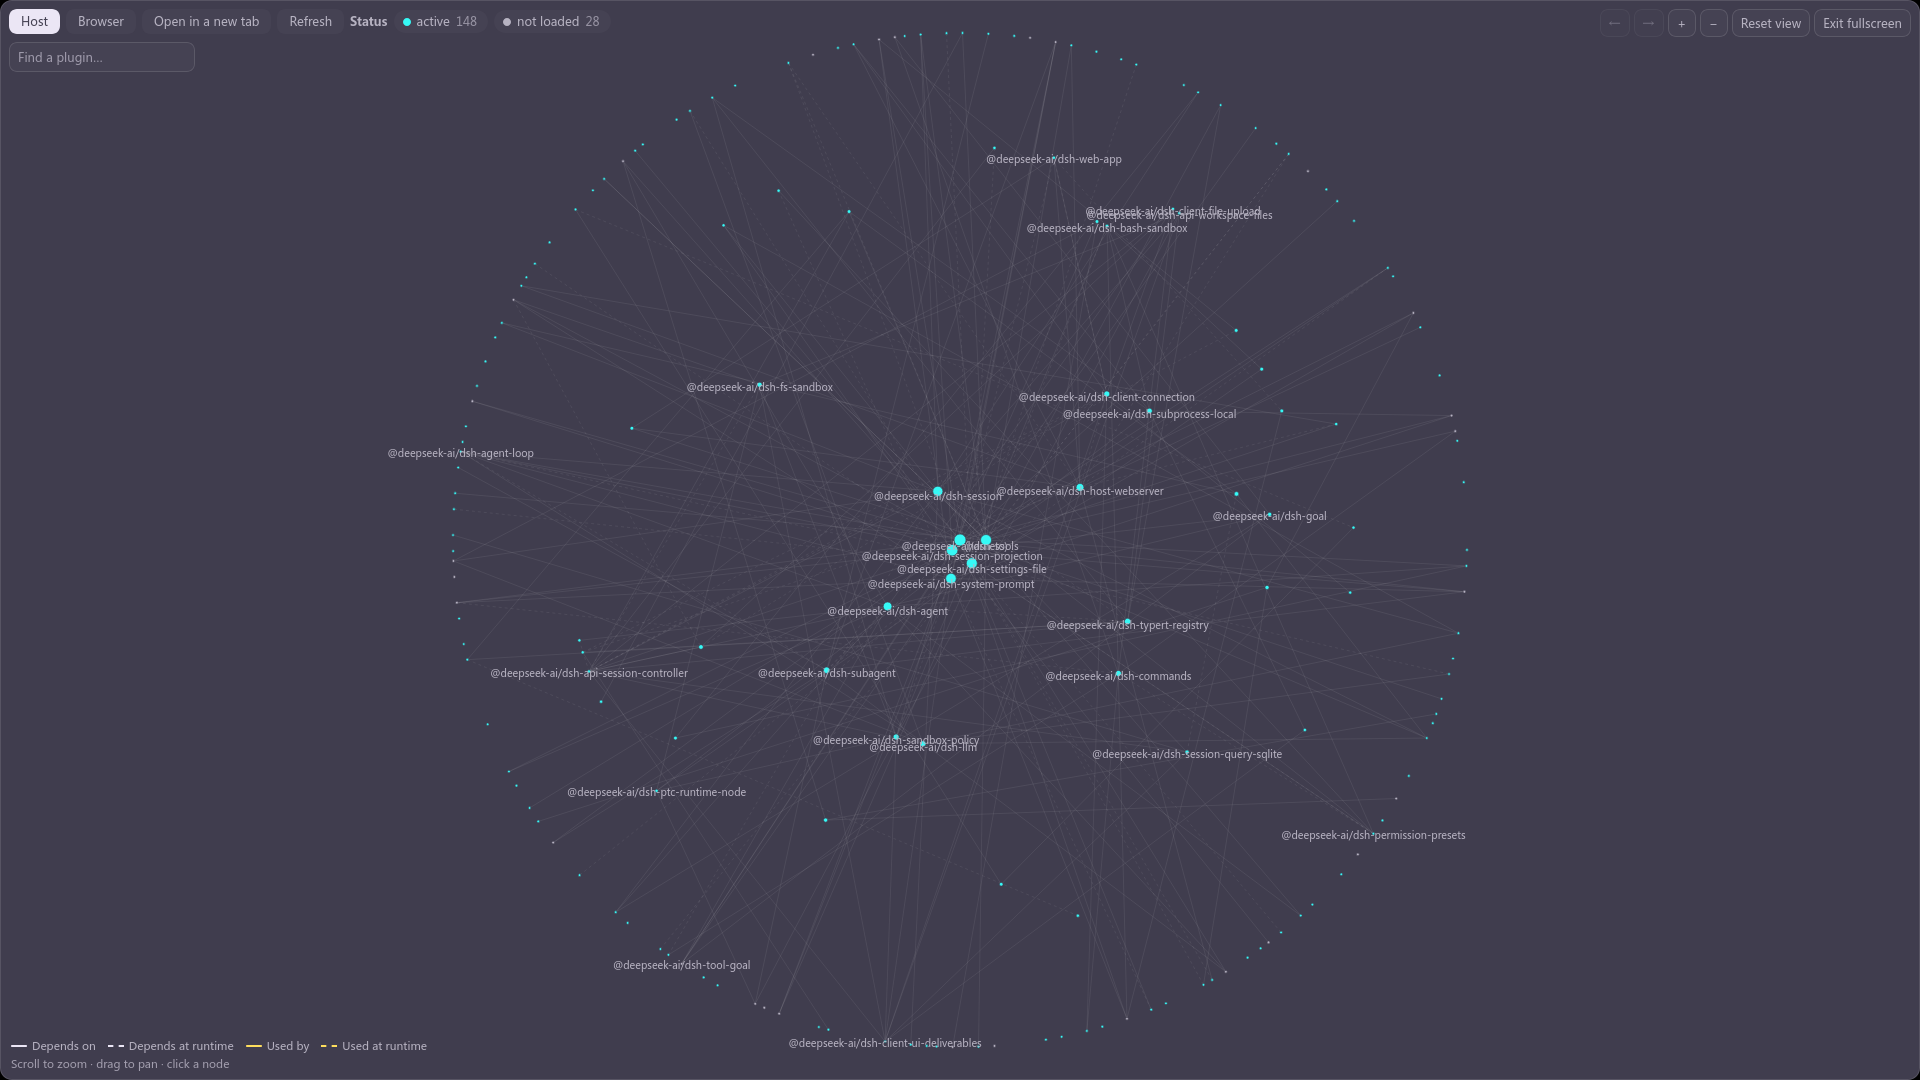
Fullscreen. The canvas IS the fullscreen element, so everything the panel put beside it is off screen — which is why the toolbar moves to the top line inside the canvas and the search box takes the second.
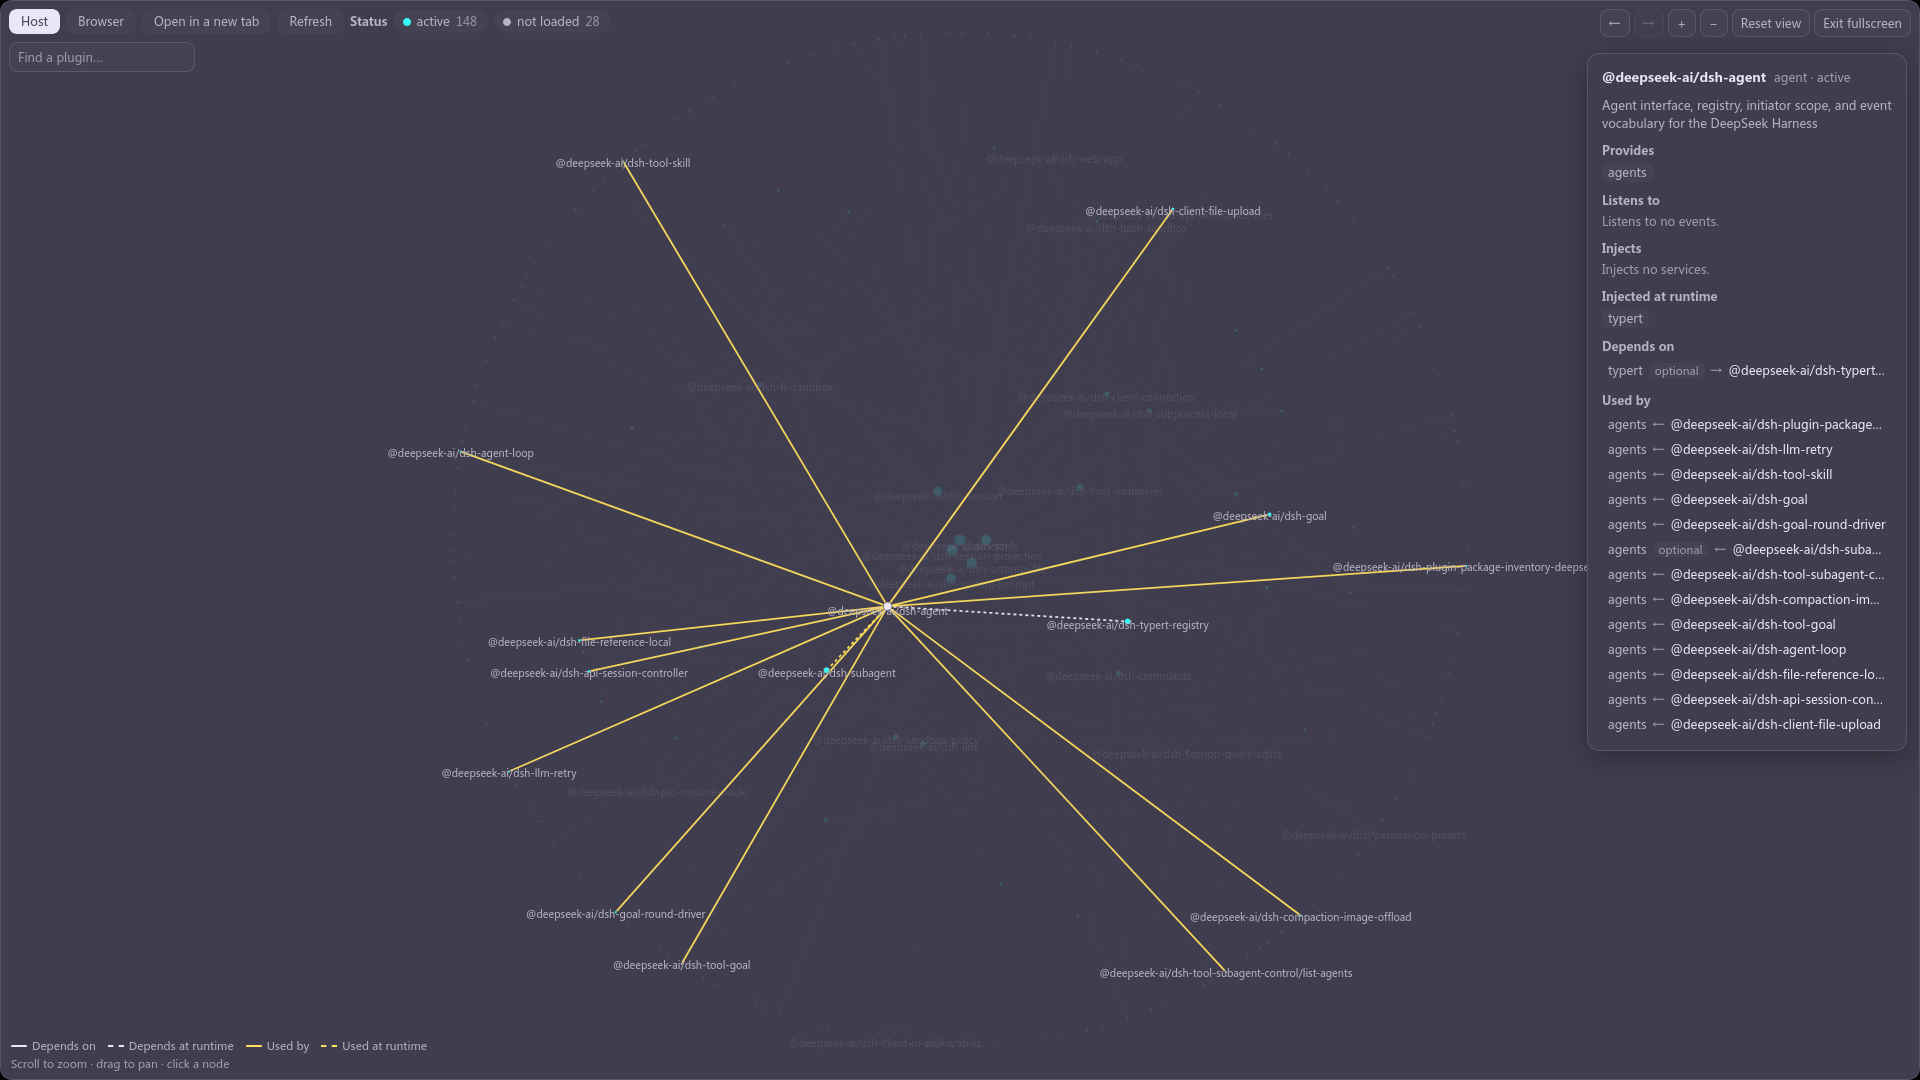
A selected node. Its own description appears under the name, Listens to says which events it subscribes to, and the wires split by direction — the key in the corner names which colour is which — dashed where the dependency is only acquired at runtime.
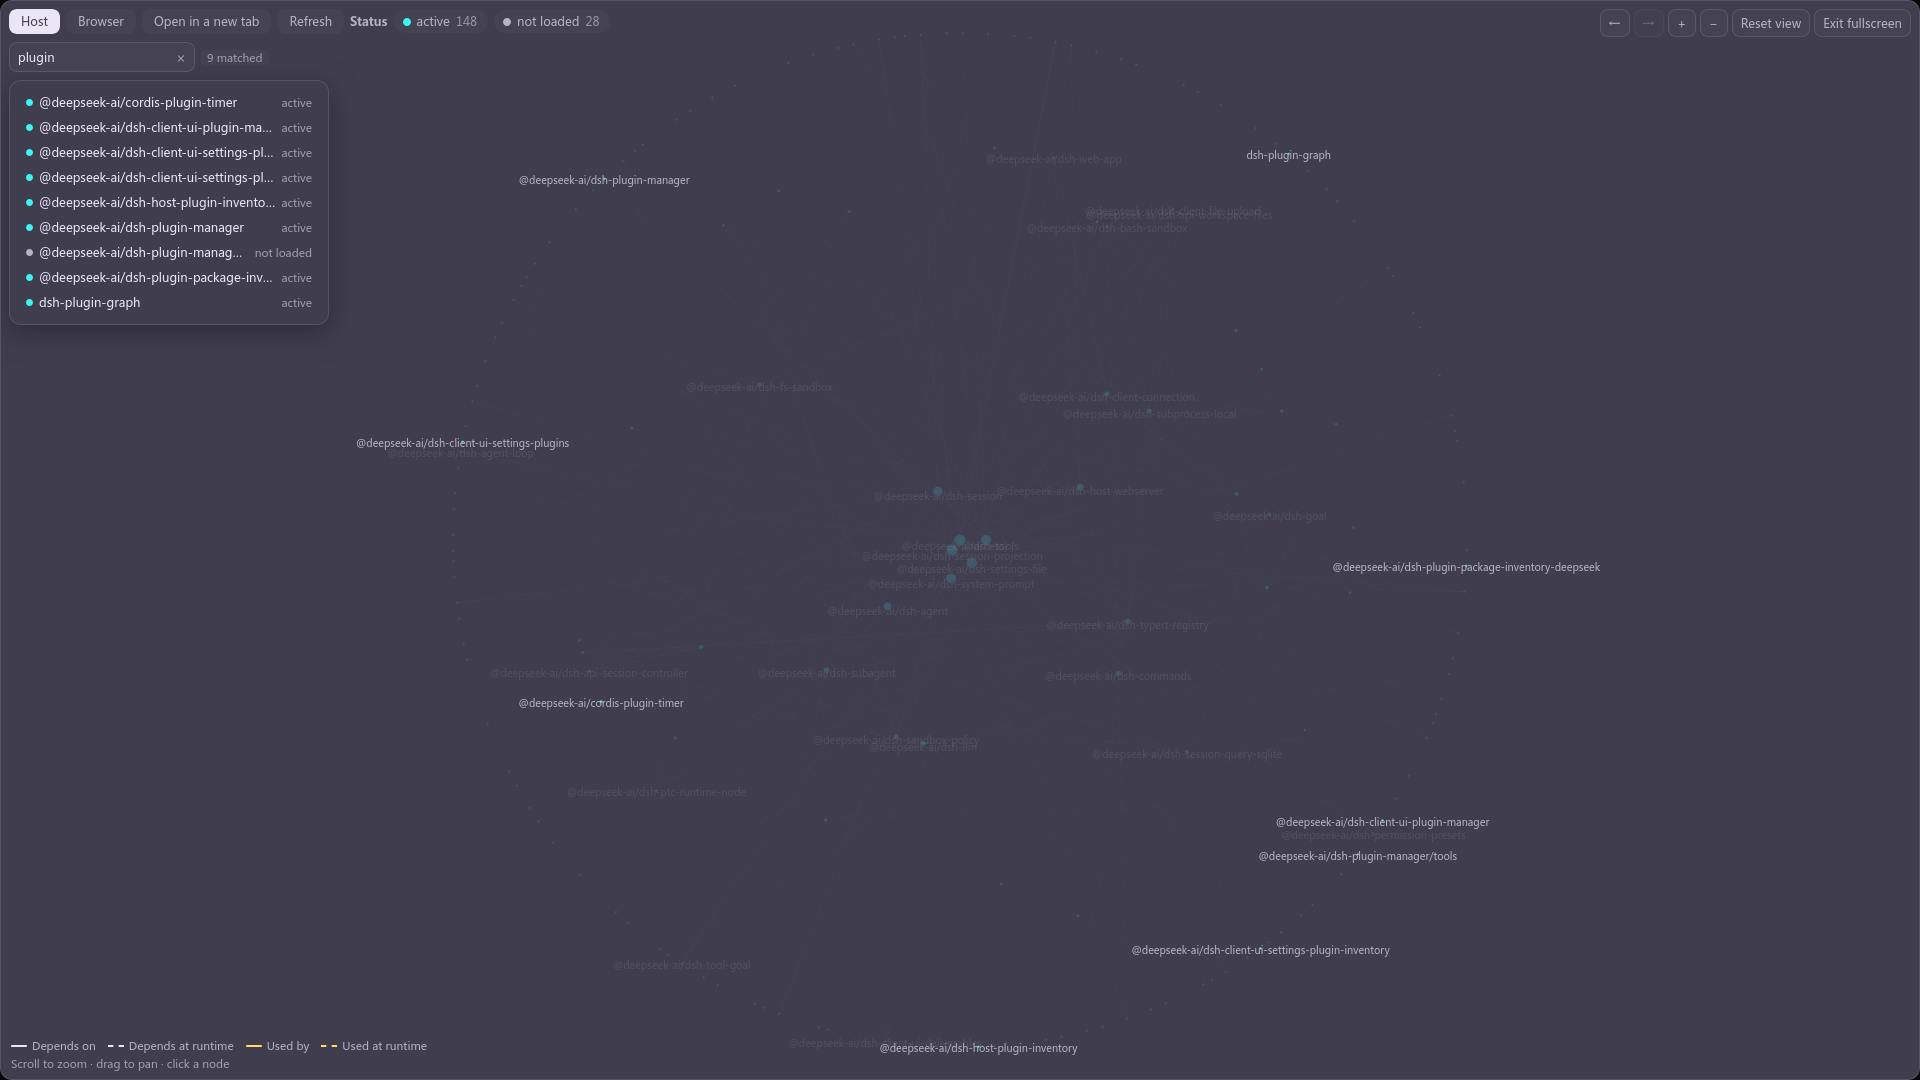
Searching. The query is matched against package names, Loader entry ids and the services a plugin
PROVIDES, so ctx.locale finds whoever offers it. The matches are listed as a card, each row
carrying the package and its state — plus the service that matched, under the name, when that is
how the row was found. The drawing dims everything else. The × in the field clears the query and
hands the caret back.
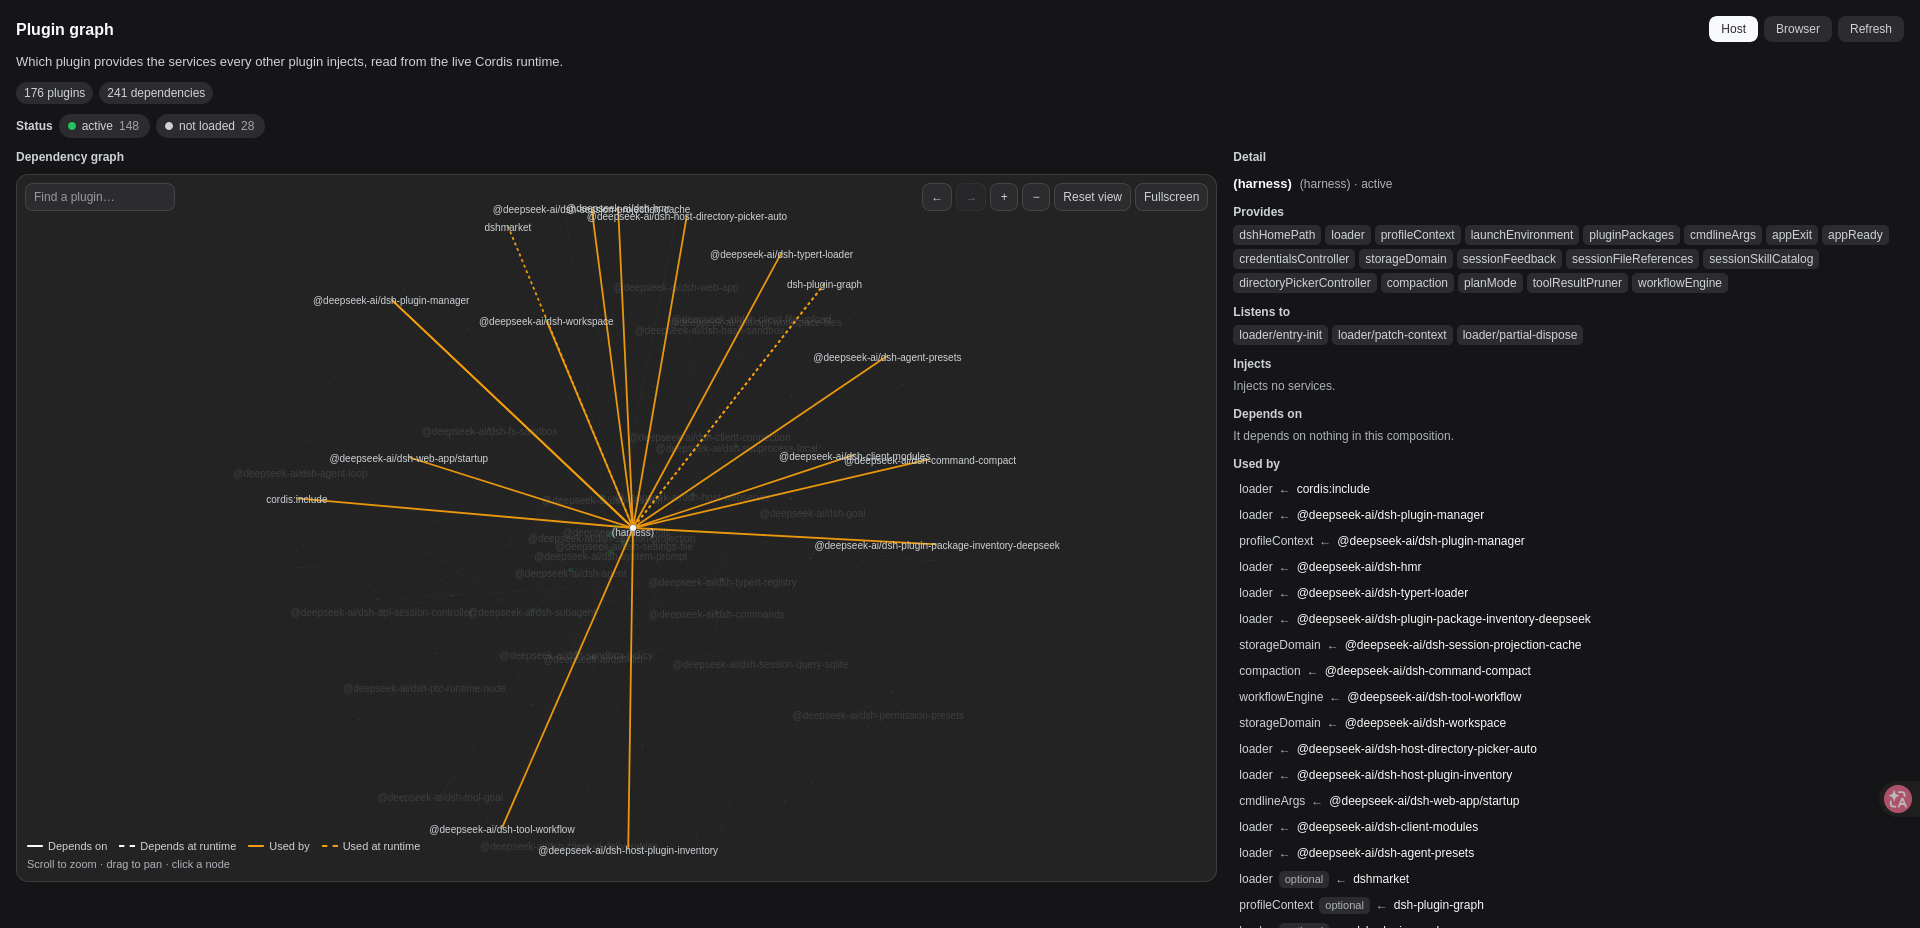
The standalone viewer, opened in a new tab: the same graph at the width of a whole window. Here it
has the (harness) node selected — the runtime's own row, which carries everything no plugin
claims: the services the root fiber provides, the services it injects, and the events it listens
to. It depends on nothing, so it has incoming wires only.
There are two Cordis runtimes, and they get two graphs:
| Host | Browser | |
|---|---|---|
| Where it runs | the Node process | the page |
| Collected by | collectGraph(ctx) on the host | collectGraph(ctx.root) in the page |
| Shown by | this section, fetched over HTTP | reported by the page, read back by the viewer |
They are never merged. They are different runtimes with different plugins and different service names, so a merged graph would not be a bigger one — it would be a wrong one. The Browser tab is a second source, not a second set of nodes.
The browser tree cannot be collected by the Node half, so the page is the only thing that can
describe it: the section POSTs what it collected to /dsh-plugin-dependency-graph/client, and the viewer
GETs it back (one path, two methods). The report carries the instant it was taken, and the
viewer prints it — a graph a reader believes is current but is not is worse than one that admits
its age.
The browser tree's descriptions come from a route of their own
(/dsh-plugin-dependency-graph/descriptions), because the page cannot read node_modules while the packages
it is describing are the same ones: this half reads them and serves a name → description table.
That read is the one place the two halves differ in capability, and it is why the merge lives in
src/describe.ts — pure, so both halves run one implementation, while only the Node half touches
node:fs. Resolution tries the plugin's own tree first, then bases learned from the host's
profileContext.dir: measured, the obvious bases all land on the checkout, where none of the
third-party plugins are installed.
A plugin can take a service two ways, and the difference is not cosmetic:
export const inject = [...], an inject: option, or the
@Inject decorator) — the fiber stays pending until every one of them resolves. The plugin
does not load without them.ctx.inject(deps, callback) helper — the callback runs once they
appear. The plugin loads either way; only that contribution waits.Both are real dependencies, both get edges, and the second is what the optional mark means. A
missing required service is a broken composition; a missing optional one is the ordinary
case the callback form exists for.
The collection reads three things, and the distinction matters: the Loader entries give the
ids and package names, the reflection store is the authoritative provider table (keyed by
isolation symbol — the fiber's own store is the wrong source and would name consumers as
providers), and the registry supplies every live fiber, including ones started at runtime.
61 with no dependencies). In the composition this was built against that is 31% of the picture —
nodes with no relation to draw, holding the rim and therefore the zoom — so they are hidden rather
than dropped: pressing the control brings them back, because "this plugin takes part in nothing" is
itself an answer a reader comes here for. A node the search or the status filter singles out is
drawn even when it has no edges, so following a result row always lands somewhere.Provides) and
everyone who injects it (marked Injects). That is what makes "who uses ctx.locale" one query
instead of a walk from node to node, and it is also why the drawing lights the service's wires: the
canvas keeps an edge only when both of its ends are in the result. A required service that NOTHING
provides is still not findable — it lives in the problems list below — and subscribed event names
are not searched either; the event blocks in the detail panel are what answer those. Each row
carries the package's state, and the list is also the way to reach a node the filter has dimmed off
to the edge. The × in the field clears the query and returns the caret to it; the field keeps the
room for that button whether or not it is showing, so nothing shifts as you type.!!js scalar is drawn as its source (the same choice the host's
own --dump-config makes — expression nodes are interpolated against the row's fiber and never
written back into the entry's options), and not schema-resolved, so a field the row never wrote is
absent rather than defaulted. The qualified path above the text is where a reader follows it back to
the file, and the view closes when another plugin is selected.Selecting a node fills the detail card with everything the runtime knows about that plugin:
package.json. Absent rather than empty when
the package does not say, or when nothing could read it — drawing no line is the truthful
rendering of "this package does not describe itself".isolate, intercept,
config — is still collected and served by the JSON route; it simply earned no rows.not loaded, exactly like one that is merely waiting, and in
that same composition all 29 of the former were the former.seen when the runtime was also
observed dispatching them. The only field on the card that is not read from the running runtime,
because the runtime cannot answer it: the dispatcher's table maps a name to its LISTENERS and never
records a publisher, and the one channel that does carry an emitter (internal/dispatch's
thisArg) is filled only for the explicit emit(thisArg, name, …) form — measured at 0 of the
host's 132 emit calls. So attribution is textual (emittedIn over the module's own files) and the
runtime's contribution is confirmation. Two consequences worth knowing: a name built at runtime is
not a literal and is missing, and any .emit( counts — including Node's EventEmitter, which is
where close, open and ready come from. Absent rather than empty in the browser tree and the
standalone viewer: those are collected where no filesystem exists, and an empty list would claim a
plugin emits nothing. Picking a name lists the plugins that listen to it — computed from the
same listens data the listeners' own cards show, out of the same collection, so the two cannot
disagree about who is listening — and each row selects that plugin. The listened names work the
same way in reverse: picking one lists the plugins whose code emits it, which is the scan's
answer and is titled as such. Where the graph was collected without a filesystem (the browser tree,
the standalone viewer) there is no scan to answer with, and the listened names stay plain tags
rather than opening an answer that would read as "nobody emits this".(harness) is the one node that is not a plugin: it is the runtime's own row. Services
provided by a fiber with no Loader entry behind it — the root fiber, and anything started outside
the entry tree — are credited here rather than dropped, and their injections and listeners come
with them. It is what keeps loader and the environment rows from reading as unresolved
dependencies of everything that injects them.
Two blocks sit under the drawing, and both are about work rather than about drawing:
A page the Node half serves as a whole document. It has no Cordis of its own, so it can only show the host's tree plus the browser report the app sent — and it reads two things from the URL it was opened with, because it cannot read them any other way:
| Parameter | Why |
|---|---|
?scheme=dark|light | the page styles itself with the app's --dsw-* tokens; the attribute that switches them is the app's, not this page's |
?lang=zh|en|ja|ko|es|fr|de | so the new tab opens in the language the app is in, instead of guessing from the browser |
The locale is whitelisted against the dictionaries before it reaches the document — a query
string is not a place to trust, and that value ends up in the page's lang attribute. A page
opened directly (no parameter) falls back to the browser's own preferences, then to English.
The browser report lives in memory only, never on disk: it describes a runtime that exists while the page is open, and a report that outlived a host restart would be describing something that is not there.
Seven dictionaries in src/client/locales.ts: zh and en (the two the shell carries) plus
ja, ko, es, fr and de, contributed one namespace at a time through the single-locale
overload — the language pack a profile carries owns the definition that makes a language
selectable, and this plugin adds only its own strings to it. It deliberately does not call
addLanguage.
Every dictionary is typed Record<MessagesKey, string>, so a key added to MessagesKey fails to
compile until all seven carry it. Wording follows session-messages, which shipped these five
first: the plugins sit in one interface, so a reader must meet the same terms in both.
dsh-plugin-dependency-graph-plugin/
  package.json        dsh.bundle + dsh.client declarations, exports map (private, not published)
  cordis.patch.yml    layer patch: the Loader row
  build.mjs           build script: bundles both halves, and copies the theme at build time
  tsconfig.json       IDE type resolution only, pointing at the checkout source (read-only)
  src/
    index.ts                 Node half: collectGraph, and the routes below
    graph-types.ts           the wire shape both halves share (types + path constants)
    collect.ts               the collector, one function for both runtimes
    describe.ts              the description merge, pure — both halves run it, only the
                             Node half reads package.json
    emits.ts                 the emitted-events scan: reads a package's own code, and
                             merges the runtime's confirmation (Node half only)
    viewer-page.ts           the standalone page's document, as a string
    viewer/main.tsx          the standalone page's body (React bundled in — that page has no
                             module table to answer a bare `react` import)
    client/
      index.ts               registers the settings section
      GraphPanel.tsx         the panel both hosts render
      graph-canvas.tsx       the drawing: layout, hit testing, zoom/pan
      search.ts              the query → the nodes it names, and which field matched
      locales.ts             the seven dictionaries
  docs/                      the screenshots above (chinese variants: `-zh.png`)
Routes, all under /dsh-plugin-dependency-graph: the graph itself, /view (the page), /viewer.js,
and /theme.css — plus /client, which takes a POST from the app and answers a GET for the viewer,
/descriptions, which serves the name → description table for the browser tree, and /config, which
takes an entry id and serves THAT entry's composed configuration.
npm run build     # bundles lib/index.js, lib/client.js and lib/viewer.js
npx tsc -p tsconfig.json   # type check
Install as a plugin in a DSH checkout by adding this directory's cordis.patch.yml to the
bundle: it inserts the single Loader row. Nothing here needs the host's source to be modified —
that is a constraint this plugin is built to, not a coincidence.
DeepSeek Harness(DSH)Web 插件聚合生态包 · 一切皆插件,创意工坊分发(dsh-market.com)
把回答做成一页可视化 HTML:模型只写简短的 Markdown 草稿,随包附带的 `am` 命令行生成页面,支持流程图、时序图、树、时间线、ER 图、表格和提示框。
在 dsh 里装上这个插件即可,无需登录、注册或填 API Key,就能使用包括 Muse Spark 1.3、MiMo V2.6 在内的前沿模型——完全免费,不限量。 All you do is install this plugin in dsh: no login, no sign-up, no API key — the frontier models are just there, Muse Spark 1.3 and MiMo V2.6 among them. Completely free, with no usage cap.

