
dsh-web
zhu1090093659/dsh-webDeepSeek Harness(DSH)Web 插件聚合生态包 · 一切皆插件,创意工坊分发(dsh-market.com)

Session cost and billing metrics for the DSH Web GUI: what this conversation cost, what the cache saved, and whether the current hour is peak or off-peak. A companion to the shipped stats pills, never a duplicate of them.
Session cost and billing metrics for the DSH Web GUI — what this conversation cost, what the cache saved, and whether the current hour is peak or off-peak. Built as a companion to the shipped stats pills, never a duplicate of them.
The shipped stats pills report tokens and context, and stop short of money. That leaves three questions unanswered, and the obvious answer to each is a lie:
A model with no rate card is not free. An unpriceable provider reads unpriced and shows its
tokens; a genuinely free model ships a card of zeros and reads a real $0.00. The two must not
render alike — unpriced means no card, and an unpriced pair is never rendered as a number.
A newly integrated provider arrives silently. DSH reports usage per provider and model; rates are configuration. Integrate a provider before its rates are entered — the case that happened with OpenRouter — and every figure for it is missing with nothing on the page saying why. The session detail names the pair it observed with no card, and the tokens it used.
Peak pricing is invisible until it is a surprise. DeepSeek bills peak and off-peak at different rates, in the provider's own timezone. Whether right now is peak is not something a user should have to derive.
Installing the plugin registers the session-metrics skill, so an agent can explain the figures
and reconfigure the rates without reading the source. Ask it what a session cost, whether a model is
priced, or how to add a rate card for a provider it has seen.
The plugin installs into your DSH profile by link — it is not published to npm, so the clone is the source. Both routes end with a restart.
git clone https://github.com/mrdhira/dsh-session-metrics.git ~/.dsh/plugins/dsh-session-metrics
cd ~/.dsh/plugins/dsh-session-metrics
./install.sh                 # builds, registers in your profile, runs pnpm install
It accepts --profile <dir> to target a profile other than ~/.dsh/profiles/desktop, --check to
report what would change without writing anything, and --remove to unregister.
1. Clone it somewhere stable (this path becomes your install path):
git clone https://github.com/mrdhira/dsh-session-metrics.git ~/.dsh/plugins/dsh-session-metrics
cd ~/.dsh/plugins/dsh-session-metrics
2. Build it. pnpm install runs the prepare script, which builds lib/** — the part DSH
actually loads. It is generated; never hand-edit it.
pnpm install
3. Register it with your profile — the dependency and the bundle name, with an absolute path:
{
  "dependencies": {
    "dsh-session-metrics": "link:/Users/<you>/.dsh/plugins/dsh-session-metrics"
  },
  "dsh": {
    "profile": {
      "bundles": [
        "dsh-session-metrics"
      ]
    }
  }
}
4. Install the link, then restart DSH:
cd ~/.dsh/profiles/desktop && pnpm install
Nothing needs adding to cordis.patch.yml: the bundle declares its own Loader row.
Restart, don't reload. The host half loads once per app process, so a host-side change needs a full quit and reopen (
⌘Q, then reopen). A page reload does not pick it up. A client-side (UI) change needs the bundle toggled in the plugin manager.
A strip should appear below the composer with cost, saved and a peak indicator. If it does not:
lib/v1/index.js exists — if not, pnpm install did not finish building;package.json names dsh-session-metrics in both dependencies and
dsh.profile.bundles;An unpriced chip means a working install with no matching rate card — not a failure. See
Configure.
A fresh install needs no configuration. Rate cards ship for deepseek-account,
deepseek-official, netra-runtime and openrouter, so the cost chip works immediately. OpenRouter
ships only the models its own catalog marks free (the :free suffix and the free-models router)
at zero rates; its paid models deliberately carry no card, because DSH reports no prices for them and
a fabricated rate is worse than a named gap.
Rates are edited in the GUI: Plugins sidebar → dsh-session-metrics. The same table can be set
in your profile's cordis.patch.yml:
- id: session-metrics
  name: dsh-session-metrics
  config:
    display: { currency: USD, primaryProvider: deepseek-account }
    budget: { sessionUsd: 5, warnAt: 0.75 }
    providers:
      - id: my-router
        models:
          - model: some/model
            rates: { flat: { cacheHit: 0.01, cacheMiss: 0.1, output: 0.25 } }
        billing: { windows: [] }      # no peak concept
Rates are USD per 1M tokens. A model takes either a flat row or a peak row with
offPeak. A provider with no billing.windows is flat and shows no peak chip.
A
providers:list in your patch replaces the shipped cards rather than adding to them. Pin your own providers and the OpenRouter free cards stop shipping with them — add a card for each pair you need, or let Seen, unpriced name the ones you missed.
| Setting | Default | What it does |
|---|---|---|
display.currency | USD | USD or CNY |
display.primaryProvider | — | hides the provider chip when the session uses this provider |
display.chips | all | which chips to show, and in what order: peak, time, cost, saved, provider, budget |
budget.sessionUsd | off | per-session ceiling; omit to disable |
budget.warnAt | 0.75 | fraction of the budget at which the strip warns |
The full rate-card format, the shipped cards and the reasoning behind them are in
docs/pricing.md.
Costs are derived from the Host's own tokenUsage projection — the same source the stats pills read
— so this plugin adds interpretation, not a second ledger. Cache savings compare each cache-hit token
against the rate that would have been paid on a miss, per the card in effect. Peak and off-peak
windows resolve in the provider's own timezone, holidays included, and the countdown is computed once
a minute while the detail view is open rather than on every render.
Two surfaces, one projection:
The plugin deliberately does not render session token totals, cache-hit rate, context percentage,
turns, steps or tok/s — the shipped pills own those. docs/data-sources.md
records which projection feeds which figure, which is what keeps the two from drifting back into
duplication.
~/.dsh/profiles/<profile>/).pnpm install # deps + build (prepare)
pnpm run build # rebuild lib/**
pnpm test # 111 tests: 105 pass, 6 skipped without a session log
pnpm run typecheck # three projects: host, browser half, tests
pnpm run test:fast # host logic only — the quick loop
pnpm run test:dom # the UI half under jsdom
DSH_SESSION_LOG=<path>.jsonl.zstd pnpm run test:replay # replays a real session
src/host/*.ts         host half: config schema, projection, ledger, pricing  -> lib/v1/index.js
src/client/index.cts  browser half: strip, detail panel, pricing page        -> lib/v1/client.js
types/dsh.d.ts        the DSH surfaces this plugin uses (the app ships no .d.ts)
build.mjs             esbuild: ESM host half, CJS browser half + loader handshake
docs/                 authoring, data-sources and pricing notes
The six skipped tests are the replay ones; they need DSH_SESSION_LOG pointing at a real recorded
session. With one, the suite is 111/111.
lib/** is generated and never hand-edited. Build before you test: the tests import the built
artifacts, so a run against a stale build is green and wrong — pnpm test builds via pretest.
111 tests across twelve files. The host half is covered table-driven — every case names the rule it pins, so a failure reads as a sentence — and the browser half mounts the real bundle under jsdom.
What the suite proves beyond "the code runs":
build.test.ts): every source module has an artifact, no artifact predates
its source, and the entrypoints main/exports name actually exist. This exists because five test
files once validated stale pre-port lib/*.js that were no longer shipped — green, and wrong.scripts/guard.mjs, which watches the whole process tree and kills it past the cap (exit 124 —
bisect, never raise it). A failing assertion must never take a DOM node as its actual value:
compare primitives (assert.ok(node === null)), because inspecting a React node walks its fiber
tree and allocates without bound.Measured on Node v24: host tests peak ~70 MB, the DOM file ~180 MB, and the full suite with a real-log replay 277 MB under a 1 GB limit.
One author: Dhira Wigata. Every commit is authored and committed by him, and CI re-checks the
whole history for a single identity and for machine-attribution trailers — so --no-verify locally
does not get a commit past CI. Signed-off-by: is fine. See AGENTS.md for the gates a
change must pass: build, typecheck across three projects, and the suite.
Issues and pull requests are welcome.
The strip as it docks under the composer, at the width the app actually gives it: DSH's own
computeColumns() resolves a 1440×900 window to a 280px sidebar and a 1160px centre column, and
that is the canvas below. Every colour is one of the app's theme tokens.
| light | dark |
|---|---|
 |  |
The detail popover behind the trigger — cost breakdown, saving breakdown, per-model rows, and the peak window with its countdown.
| light | dark |
|---|---|
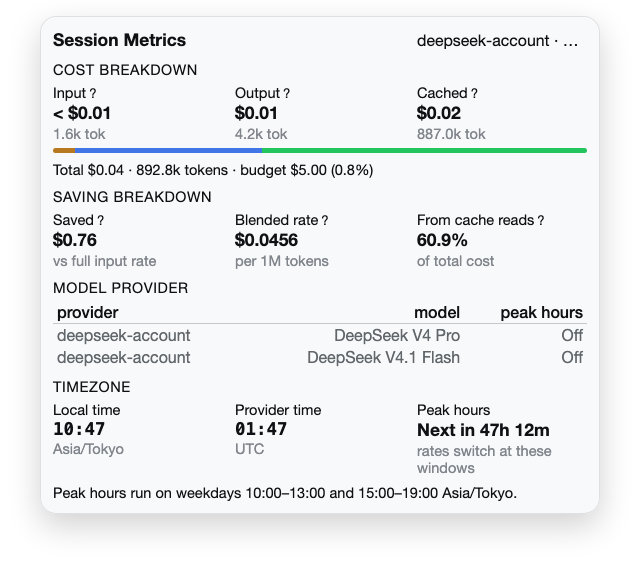 | 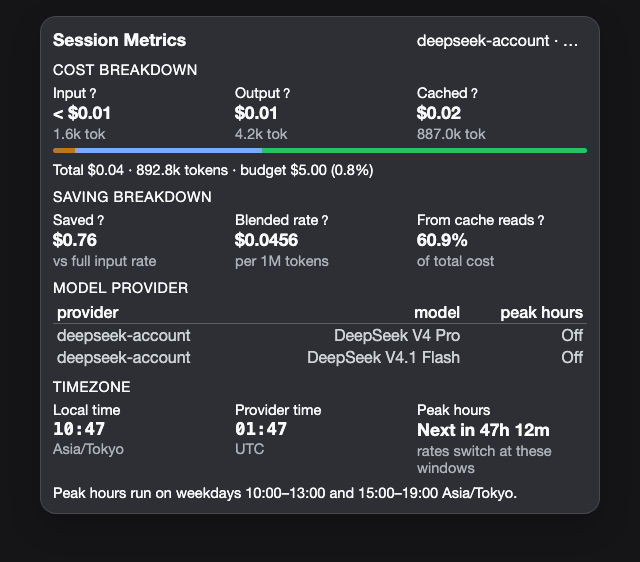 |
Both come from scripts/capture-panel.mts, which renders the real bundle through
test/harness.ts — the same path the DOM tests take — injects the real stylesheet the bundle
itself ships, and resolves the --dsw-* tokens out of the installed app.asar. Nothing is mocked and
no colour is hand-picked. Run it with:
node ~/.dsh/scripts/guard/guard.mjs --limit-mb 2560 -- \
  node --max-old-space-size=384 scripts/capture-panel.mts
One honest gap: the popover is captured standalone, centred by a layout wrapper, rather than
anchored under the strip. Its left/bottom come from a live getBoundingClientRect() of the docked
trigger, and the headless renderer has no layout engine to produce one — so its content, width and
styles are real, and only the frame around it is not.
This is a metrics panel, not a pipeline: the strip and the popover are two projections of one
already-complete figure. Costs are derived from the Host's own tokenUsage projection, savings compare
each cache-hit token against the miss rate on the same card, and the peak state is a clock read against
the provider's window — all computed in the browser half on render. No queue, no stages, no hand-off,
and no ordering a diagram would add information to. A flow diagram here would be decoration, so there
is none; the data path is the table in docs/data-sources.md instead.
MIT © Dhira Wigata
DeepSeek Harness(DSH)Web 插件聚合生态包 · 一切皆插件,创意工坊分发(dsh-market.com)
把回答做成一页可视化 HTML:模型只写简短的 Markdown 草稿,随包附带的 `am` 命令行生成页面,支持流程图、时序图、树、时间线、ER 图、表格和提示框。
在 dsh 里装上这个插件即可,无需登录、注册或填 API Key,就能使用包括 Muse Spark 1.3、MiMo V2.6 在内的前沿模型——完全免费,不限量。 All you do is install this plugin in dsh: no login, no sign-up, no API key — the frontier models are just there, Muse Spark 1.3 and MiMo V2.6 among them. Completely free, with no usage cap.

